- Acura
- Alfa Romeo
- Aston Martin
- Audi
- Bentley
- BMW
- Buick
- Cadillac
- Chevrolet
- Chrysler
- Dodge
- Ferrari
- Fiat
- Ford
- Genesis
- GMC
- Honda
- Hyundai
- Infiniti
- Jaguar
- Jeep
- Kia
- Lamborghini
- Land Rover
- Lexus
- Lincoln
- Lotus
- Lucid
- Maserati
- Maybach
- Mazda
- McLaren
- Mercedes-Benz
- MINI
- Mitsubishi
- Nissan
- Pagani
- Porsche
- Ram
- Rivian
- Rolls-Royce
- SMART
- Subaru
- Tesla
- Toyota
- Volkswagen
- Volvo

#infographic

How to Avoid Purchasing a Flood-Damaged Vehicle
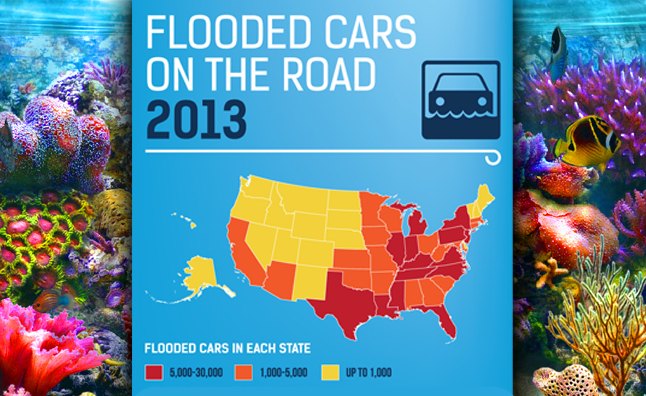
Buying a used vehicle is always risky. Even if it’s certified, inspected and under warranty there’s no telling how the previous owner (or owners) treated it. In addition to lackadaisical maintenance water damage is a major issue to be concerned with as well.
How to Get Your Car Stolen: Infographic
Car theft season is here, as we learned earlier this month. Looking for a quick laugh this morning? Take a look at this infographic describing the best ways to get your car stolen.
Chevrolet Spark Stacks up to 1973 Full-Size Sedan – Infographic
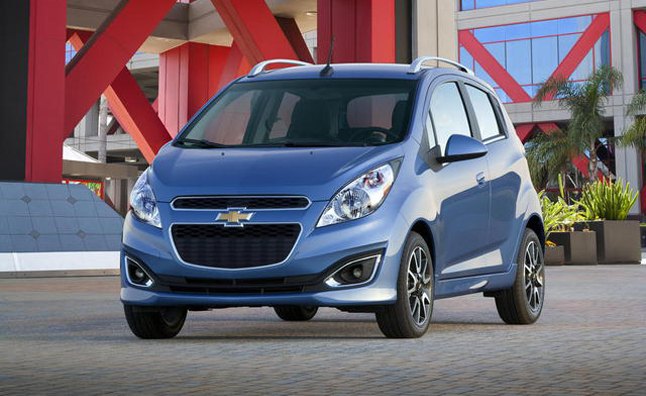
Ask anyone older than 55 how cars have changes since the ’70s and they’ll probably mention, among many other things, that they’ve shrunk considerably.
Commuting Can Carry Negative Health Effects: Infographic

Commuting into town can be one of the most miserable parts of your day. A group of students at College@Home has done some research to find out exactly what your commute is doing to you mentally and physically.
Taffic Jam Infographic: Top 10 Most Congested Cities in U.S.
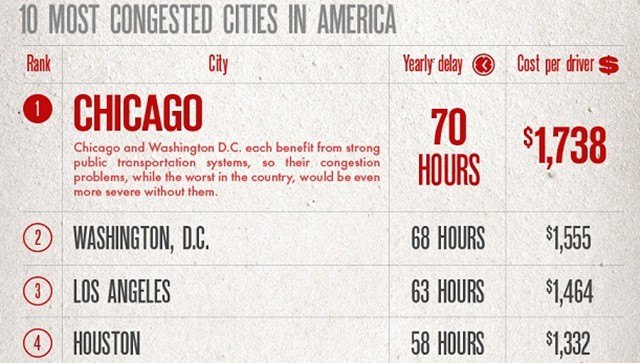
If you think you’ve got it bad when commuting to work, well, it could be worse – you could be living in Chicago. According to Carbuzz’s infographic, the Windy City is the most congested in the U.S.
This nifty infograhic is a wealth of enlightening traffic info. Take Chicago, for example. If you’re a driver there, you can expect to be delayed 70 hours a year, which will cost you an extra $1,738. And that’s why Chicago ranked #1 on the list. Also on the list are Washington, DC in second, where you’ll be delayed by 68 hours and spend $1,555 a year, followed by Los Angeles (63 hours and $1,464) and Houston (58 hours and $1,332).
The infographic also goes on the show some other interesting numbers, such as the percentage of people who had to cancel plans in the last month due to traffic delays (47 percent) and that the average person spends an average of two weeks a year in traffic jams in cities across the U.S. And can you guess what city makes it to the top of the worst commuter cities worldwide? You may be surprised!
You can see all of the interesting data provided on the infographic after the jump.
[Source: Autoblog]
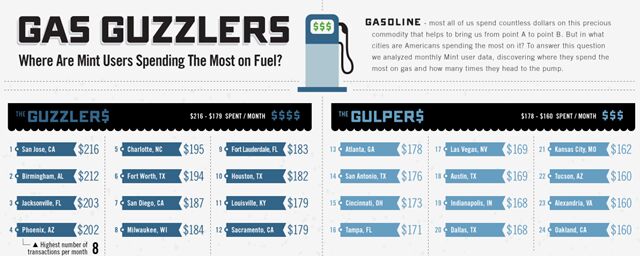
Infographic: What Cities Pay The Most For Gas?
ga
Read more
A new study released by Mint went on a fact finding mission to find out who is pay more to fill up their cars.
Prices vary from city to city, so gas prices may not be affect all of us equally. This new study reveals that residents of some cities pay more than twice as much for gas a month compared to drivers in other towns and cities across the states. Data was complied from data reported by visitors to Mint.com.
If you’re living and driving in San Jose, CA, you’re spending the most in fuel (about $216 per month). New York City residents, on the other hand, spend the least ($102 a month). Of course, the graph doesn’t take into account how much New Yorkers spend on subway fares and taxis, which if added to the monthly fuel bill, would see it rise to a certain extent.
You can see where your city falls in the infographic after the jump.
[Source: Autoblog Green]