- Acura
- Alfa Romeo
- Aston Martin
- Audi
- Bentley
- BMW
- Buick
- Cadillac
- Chevrolet
- Chrysler
- Dodge
- Ferrari
- Fiat
- Ford
- Genesis
- GMC
- Honda
- Hyundai
- Infiniti
- Jaguar
- Jeep
- Kia
- Lamborghini
- Land Rover
- Lexus
- Lincoln
- Lotus
- Lucid
- Maserati
- Maybach
- Mazda
- McLaren
- Mercedes-Benz
- MINI
- Mitsubishi
- Nissan
- Pagani
- Porsche
- Ram
- Rivian
- Rolls-Royce
- SMART
- Subaru
- Tesla
- Toyota
- Volkswagen
- Volvo


#commute
Commuting Can Carry Negative Health Effects: Infographic

Commuting into town can be one of the most miserable parts of your day. A group of students at College@Home has done some research to find out exactly what your commute is doing to you mentally and physically.

Taffic Jam Infographic: Top 10 Most Congested Cities in U.S.
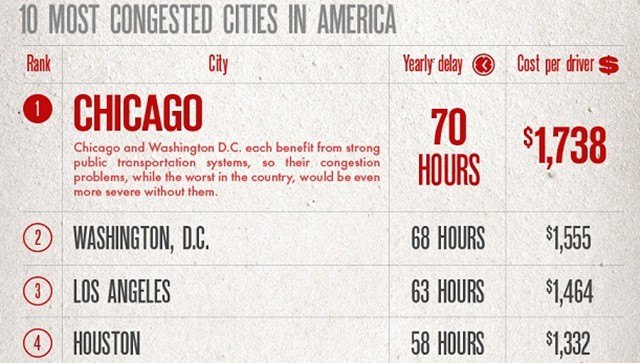
If you think you’ve got it bad when commuting to work, well, it could be worse – you could be living in Chicago. According to Carbuzz’s infographic, the Windy City is the most congested in the U.S.
This nifty infograhic is a wealth of enlightening traffic info. Take Chicago, for example. If you’re a driver there, you can expect to be delayed 70 hours a year, which will cost you an extra $1,738. And that’s why Chicago ranked #1 on the list. Also on the list are Washington, DC in second, where you’ll be delayed by 68 hours and spend $1,555 a year, followed by Los Angeles (63 hours and $1,464) and Houston (58 hours and $1,332).
The infographic also goes on the show some other interesting numbers, such as the percentage of people who had to cancel plans in the last month due to traffic delays (47 percent) and that the average person spends an average of two weeks a year in traffic jams in cities across the U.S. And can you guess what city makes it to the top of the worst commuter cities worldwide? You may be surprised!
You can see all of the interesting data provided on the infographic after the jump.
[Source: Autoblog]